


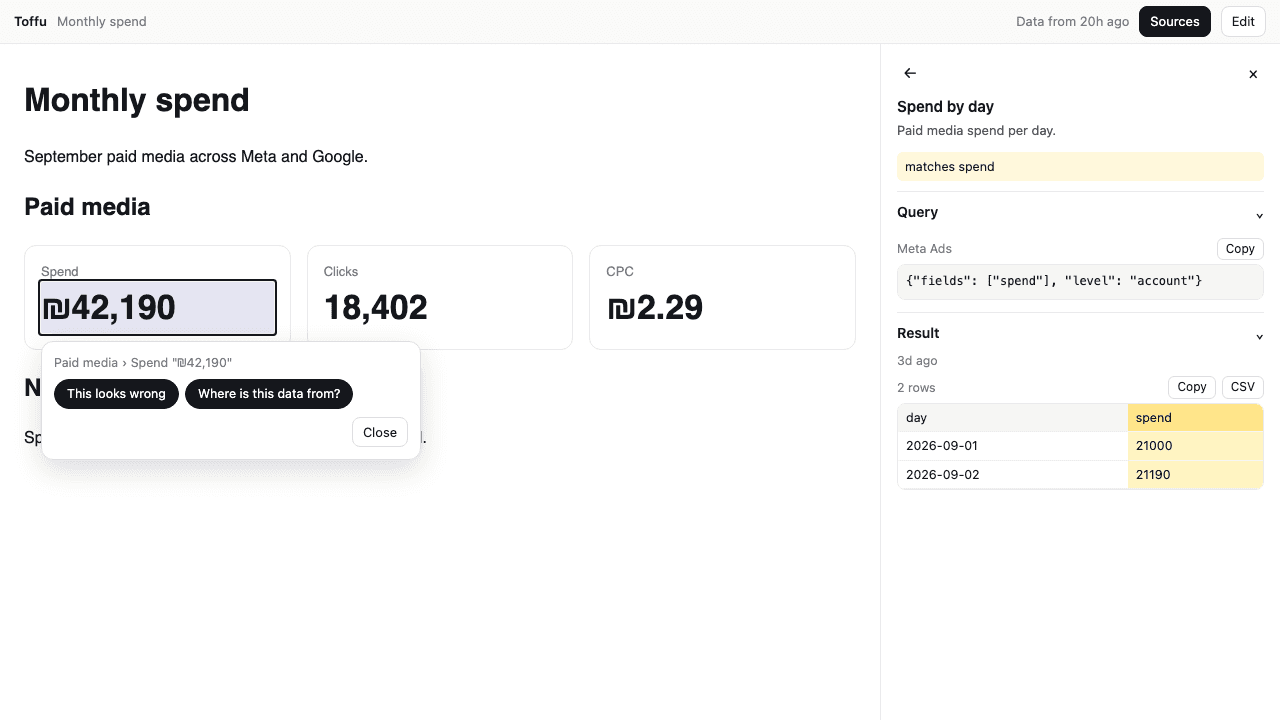
Reports and dashboards from Toffu now open inside Toffu, with a bar on top. Click any number to see the query and the rows it came from, ask Toffu about it beside the report, and edit the text without leaving the page.
Click a number, see its source
Click Sources and every number that comes from data lights up. Click one and the panel opens on the dataset behind it:
- The query that ran, as it ran, so an analyst can check it line by line.
- The rows it returned, with the time they were read.
- How the page turned the rows into the number: a single value, a total over a date range, a running total.
You no longer need to rebuild a report's logic to trust it. The answer to "where does this come from?" is one click away, on the report itself.
Ask Toffu about any number
Select a number and pick a question: Where is this data from? or This looks wrong. Toffu opens beside the report, already holding the query and the rows behind that number, so it starts from the data instead of searching for it.
- Short answers. Where the number comes from and how it is computed, in a few lines. Ask for more if you want it.
- One chat per question. A new number starts a new chat, so an earlier answer never muddies the next one.
- The report stays on screen. You read the answer next to the number it is about.
"This looks wrong" is how you fix a number: tell Toffu what to change, the filter, the date range or the target, and it changes the dataset behind it.
Live dashboards that load card by card
A live dashboard reads its data when you open it, not on a schedule. Each card loads on its own and fills as soon as its own data arrives:
- No blank page. The headings, filters and layout show at once; each card shimmers until its numbers land.
- One slow source never blocks the rest. If one dataset fails, that card says so and retries. The others carry on.
- Instant on repeat visits. If you opened the page recently, you see the last numbers at once while fresh ones load in the background.
- Links that stay alive. A dashboard people keep opening keeps working; it renews itself while it is in use.
Edit in place, without a reload
Click Edit and the report's text becomes editable where it stands: titles, labels, notes and commentary. Save keeps your changes; Discard drops them. The page never reloads and never leaves your screen.
Numbers on a live dashboard are not typed in: they come from the data each time the page loads. To change one, change where it comes from: select it, choose This looks wrong, and tell Toffu what to change. On a report with fixed data, numbers are plain text and you can edit them like any other words.
How to try it
It is on now in every Toffu workspace:
- Ask Toffu for a dashboard, as you do today.
- Open the report link. Signed in, you land on the report inside Toffu, with the bar on top.
- Click Sources, pick a number, and ask.
Clients you share a report with still get the plain report through the same link.